CityProtect Incident Map
In order to more effectively share crime incidents with the community, the Los Altos Police Department reports crime data to the CityProtect interactive crime map. The CityProtect tool provides the ability to view crime incidents from Los Altos and other reporting jurisdictions. While the map is not real-time, the data is uploaded every 24 hours. You can view up to one year of data, and can filter to see specific time periods. Note: you will need to enable Javascript in order to view the crime map.
In addition to the crime incident map, CityProtect also enables you to view national sex offender data, submit an anonymous tip, and sign-up for free, automated, email crime alerts.
VIEWING REPORTED INCIDENTS ON THE INTERACTIVE MAP
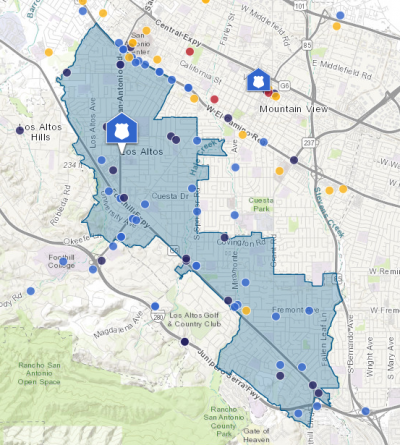
- Look at the color of the dot to learn what type of incident occurred:
- Blue dots represent disorder or disturbance calls. These include drugs, liquor, and quality-of-life events;
- Yellow dots represent property or theft crimes;
- Red dots represent violent crimes like assault, homicide, kidnapping or robbery.
- Zoom in on the map until the dots change into icons or symbols, indicating the type of crime
- Click on the individual icon and information on that incident will appear in the left pane, telling you the date/time, location, and more.
- For privacy reasons, incident reports do not identify a specific business or residence, but are displayed with the general geographical area.

HOW TO FILTER THE DATA
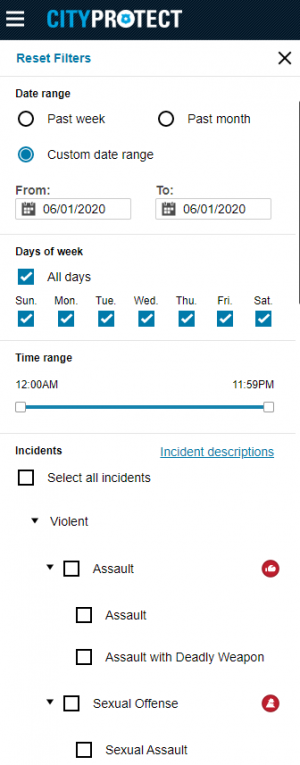
On the left pane, click "Filter" to change the date range and add or remove crime and call types to better locate the information that interests you.
Sex crimes, child abuse, and domestic violence crime are not on the map as those victims are protected by law. Megan’s Law provides sex offender map and name look-up tools https://www.meganslaw.ca.gov/.
REGISTER YOUR VIDEO SECURITY CAMERAS
Additionally, you can register your video security cameras with CityProtect.


